Planning
Cashflow
Every day ahead: what comes in, what goes out, and the lowest point.
The forecast
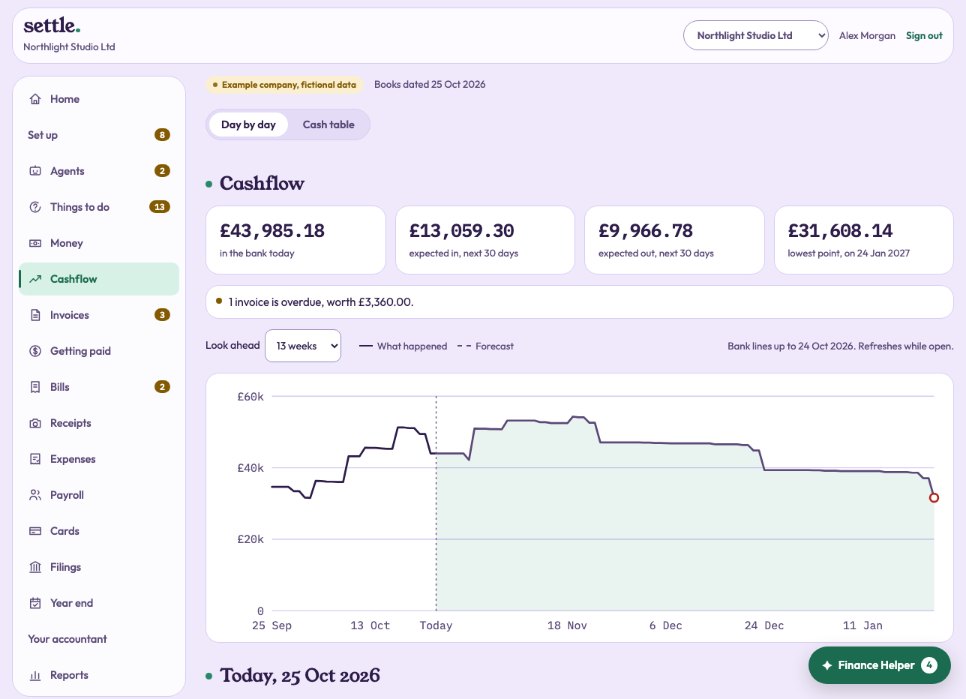
Cashflow starts from today’s bank balance and looks ahead 30 days, 13 weeks, 6 months or a year. The tiles show what is expected in and out over the next 30 days, and the lowest point ahead. Warnings appear if the money would run out, fall below your comfort level, or tax is due soon.
What is in it
Unpaid invoices (moved by how late that customer usually pays), bills on their due or pay-on date, costs you pay most months, payroll, VAT and Corporation Tax, repeating invoices, loans, and anything you add yourself.
Day by day
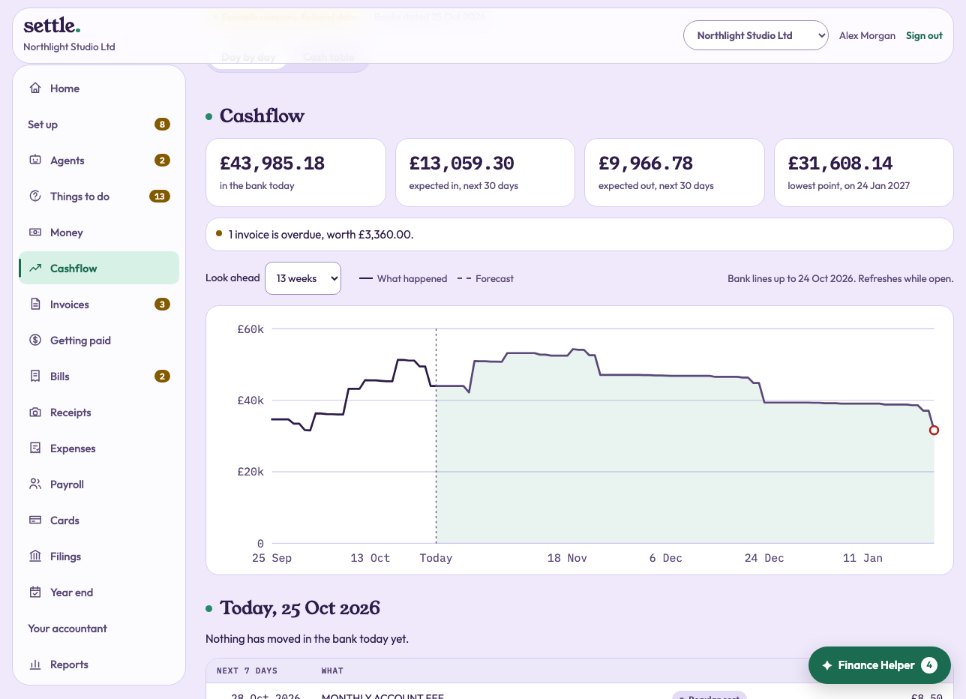
Each line says how firm it is: firm, likely, uncertain or planned. The balance is what the bank should show at the end of that day. Money to chase lists overdue invoices, with Send a reminder.
Adding what you know is coming
A new hire, a deposit, a big order: give what it is, the amount, in or out, the date and how often it repeats. It only changes the forecast, never the books. Set Warn me if the balance would fall below to your comfort level.
The cash table
Choose Cash table at the top of Cashflow to see it as a spreadsheet: each category down the side, each month across, with the opening balance, money in, money out and the closing balance. Months gone by are what went through the bank. This month is what has gone through so far plus what is still expected. Later months are the forecast, shaded blue. Choose how many months back and ahead to show.
Click any figure to see what is behind it: the bank lines for a past month, or the invoices, bills, payroll, tax and plans that make up a forecast. Uncoded payments have rows of their own until they are coded.
To change the forecast, click a month ahead, type the amount for the month (money out as a plain number), choose whether to use it for the next few months too, and press Save. Your figure replaces what was worked out for that category in that month, in the table and in Day by day, and is shaded yellow. Use the average of the last 3 months or Use the budget fill the box for you. Back to the worked-out figure undoes it. To plan a category that has nothing in it yet, choose it under Plan for another category.
Scenarios that are switched on are included, with a line for the closing balance without them. Download as a spreadsheet saves the table as a CSV file. People with view-only access can look and click, but not change figures.
Still stuck? Ask in the Finance Helper inside the app, or contact your accountant.